OpenTelemetry, Spring Boot and Kafka
Introduction
Finding the root cause of problems in the software is a pretty complex topic. With distributed systems, another layer of the ultimate complexity, the problem becomes harder to solve. To make a distributed system more observable, one needs to implement proper tracing, apart from logging and metrics.
Distributed tracing allows to track requests and how they travel on the distributed system. It enables engineers to debug with a more precise picture of the system for the given issue.
What is OpenTelemetry?
OpenTelemetry? OpenTelemetry is the industry standard with ready-to-use implementations to enable the effective creation and collection of telemetry data (metrics, logs, and traces) and to forward them to external tools.
It has already SDKs, which are ready to use by many popular libraries and frameworks. Spring Boot is no exception. Spring Boot provided tracing with the spring-cloud-starter-sleuth but the transition to OpenTelemetry created the need for a fairly new spring project spring-cloud-starter-sleuth-otel.
The tendency to switch to OpenTelemetry is backed up by the fact: It is vendor agnostic. Data can be exported to any external entity that knows how to read format. Awesome.
An intro to the tracing is given in the next chapter.
What is tracing?
Tracing allows us to put identity on request in our system and track it on its journey. The request is not only HTTP/S but also an event messaging system message(eg. Kafka message), or some other kind of request which is supported by the instrumentation library and framework used.
Three pillars of tracing are Span, SpanContext, and Trace.
Span
The “span” is the primary building block of a distributed trace, representing an individual unit of work done in a distributed system.
SpanContext
The SpanContext carries data across process boundaries. Specifically, it has two major components:
- An implementation-dependent state refers to the distinct span within a trace
- A key:value pairs that cross process boundaries.
Trace
The collection of Spans that have the same root is considered to create a group called trace.
To read more about opentracing, check out https://opentracing.io/docs/overview/spans/.
Tracing example
Let's see how can we practically leverage tracing. The setup of the services is drawn in the next picture.
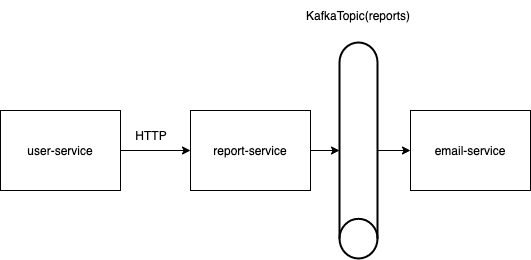
As you can see there are three services:
user-service(Providing HTTP API to the external world)report-service(Providing HTTP API to the user-service and KafkaProducer to send events to topic reports)email-service(Providing KafkaConsumer, listening to the topic reports).
What is the goal? Track the request from the start (user-service) to the end. From the user-service to the email-service.
Architecture is simplified for demonstration purposes. The real benefit of tracing would be seen in architecture where we have N services communicating with each other (Where N is a large number. Define large for yourself.).
Deploying tracing infrastructure
Infrastructure architecture is described in detail in the docker-compose.yaml. Let's group the deployments into the two groups:
- application services
- infrastructure services
Infrastructure applications:
jaeger-all-in-oneotel-collectorzookeeperkafka
Jaeger is used for visualizing the traces. Otel-collector handles input fromspring-otel-exporter, transforms(Optionally), and sends data to Jaeger. Zookeeper and Kafka are usual suspects.
Since every one of these tools is a broad topic in itself focus will not be on introducing them. Official documentation can be found below:
- https://www.jaegertracing.io/
- https://opentelemetry.io/docs/collector/
- https://zookeeper.apache.org/
- https://kafka.apache.org/
Configuring maven for OpenTelemetry support
To include open-telemetry and sleuth configure the pom.xml like the one provided.
<?xml version="1.0" encoding="UTF-8"?>
<project xmlns="http://maven.apache.org/POM/4.0.0" xmlns:xsi="http://www.w3.org/2001/XMLSchema-instance"
         xsi:schemaLocation="http://maven.apache.org/POM/4.0.0 https://maven.apache.org/xsd/maven-4.0.0.xsd">
    <modelVersion>4.0.0</modelVersion>
    <parent>
        <groupId>org.springframework.boot</groupId>
        <artifactId>spring-boot-starter-parent</artifactId>
        <version>2.6.5</version>
        <relativePath/> <!-- lookup parent from repository -->
    </parent>

    <groupId>com.tracing</groupId>
    <artifactId>tracing</artifactId>
    <version>0.0.1-SNAPSHOT</version>
    <packaging>pom</packaging>

    <modules>
        <module>tracing-commons</module>
        <module>tracing-email</module>
        <module>tracing-user</module>
        <module>tracing-report</module>
    </modules>

    <properties>
        <java.version>11</java.version>
        <spring-cloud.version>2021.0.1</spring-cloud.version>
        <spring-cloud-sleuth-otel.version>1.1.0-M5</spring-cloud-sleuth-otel.version>
    </properties>

    <dependencyManagement>
        <dependencies>
            <dependency>
                <groupId>org.springframework.cloud</groupId>
                <artifactId>spring-cloud-dependencies</artifactId>
                <version>${spring-cloud.version}</version>
                <type>pom</type>
                <scope>import</scope>
            </dependency>
            <dependency>
                <groupId>org.springframework.cloud</groupId>
                <artifactId>spring-cloud-sleuth-otel-dependencies</artifactId>
                <version>${spring-cloud-sleuth-otel.version}</version>
                <scope>import</scope>
                <type>pom</type>
            </dependency>
        </dependencies>
    </dependencyManagement>

    <build>
    </build>

    <dependencies>
        <dependency>
            <groupId>org.springframework.boot</groupId>
            <artifactId>spring-boot-starter-web</artifactId>
        </dependency>

        <dependency>
            <groupId>org.springframework.boot</groupId>
            <artifactId>spring-boot-starter-data-jpa</artifactId>
        </dependency>

        <dependency>
            <groupId>org.springframework.cloud</groupId>
            <artifactId>spring-cloud-starter-sleuth</artifactId>
            <exclusions>
                <exclusion>
                    <groupId>org.springframework.cloud</groupId>
                    <artifactId>spring-cloud-sleuth-brave</artifactId>
                </exclusion>
            </exclusions>
        </dependency>

        <dependency>
            <groupId>org.springframework.cloud</groupId>
            <artifactId>spring-cloud-sleuth-otel-autoconfigure</artifactId>
        </dependency>

        <dependency>
            <groupId>io.opentelemetry</groupId>
            <artifactId>opentelemetry-exporter-otlp-trace</artifactId>
        </dependency>

        <dependency>
            <groupId>org.springframework.kafka</groupId>
            <artifactId>spring-kafka</artifactId>
            <version>2.8.4</version>
        </dependency>
    </dependencies>

    <repositories>
        <repository>
            <id>spring-snapshots</id>
            <url>https://repo.spring.io/snapshot</url>
            <snapshots>
                <enabled>true</enabled>
            </snapshots>
        </repository>
        <repository>
            <id>spring-milestones</id>
            <url>https://repo.spring.io/milestone</url>
        </repository>
    </repositories>
    <pluginRepositories>
        <pluginRepository>
            <id>spring-snapshots</id>
            <url>https://repo.spring.io/snapshot</url>
        </pluginRepository>
        <pluginRepository>
            <id>spring-milestones</id>
            <url>https://repo.spring.io/milestone</url>
        </pluginRepository>
    </pluginRepositories>

</project>
Configuring pom.xml and importing dependencies is 90% of the job.
Since the Java applications are configurable through the properties and YAML files configuration the otel-starter can be modified in the application.yaml. This is one of the things I love about Spring and Java in general.
spring:
  sleuth:
    otel:
      config:
        trace-id-ratio-based: 1.0
      exporter:
        otlp:
          endpoint: http://sleuth:4317
The endpoint and probability for trace exporting for the otel-collector are configured in the YAML. Config provides also other properties to modify for the spring-otel starter (Configuration properties).
spring.sleuth.otel.config.trace-id-ratio-based property defines probability of 100% exporting traces (Mapping [0.0, 1.0] -> [0, 100]%).Important: If the ratio is less than 1.0, then some traces will not be exported (It can make you think that it’s not working).
The otel-collector configuration is configured in the docker-compose.yaml but let's glance over it quickly.
extensions:
  memory_ballast:
    size_mib: 512
  zpages:
    endpoint: 0.0.0.0:55679

receivers:
  otlp:
    protocols:
      grpc:
      http:

processors:
  batch:

exporters:
  logging:
    logLevel: debug
  jaeger:
    endpoint: jaeger-all-in-one:14250
    tls:
      insecure: true

service:
  pipelines:
    traces:
      receivers: [ otlp ]
      processors: [ batch ]
      exporters: [ logging, jaeger ]
  extensions: [ memory_ballast, zpages ]
Otel-collector works in a next manner:
As can be seen from the configuration snippet, otel-collector is highly configurable. That's the thing we talked about in the intro of this article.
The picture from the official docs depicts how otel-collector can be configured.

Analyzing logs and traces
To analyze logs and traces, it's possible to check out the stdout of the application itself. Log output in te application service will display traceId and spanId. The example is shown below.
2022-04-01 18:21:45.984 INFO [user-service,f515bcf46b607671e1182d5903a5d261,779f554008223b4c] 1 --- [nio-8080-exec-1] c.tracing.service.users.UserController : Creating new report for user: 1When the request goes to the other service its logs will have the same trace.
2022-04-01 18:21:46.617 INFO [report-service,f515bcf46b607671e1182d5903a5d261,75dc1c69c94bf0f2] 1 --- [nio-8080-exec-1] c.t.service.reports.ReportController : Creating new report: 1That way when the otel-exporter provides data to the Jaeger, Jaeger can understand the data and visualize the path of a request. Let’s see the full path of requests represented in Jaeger.
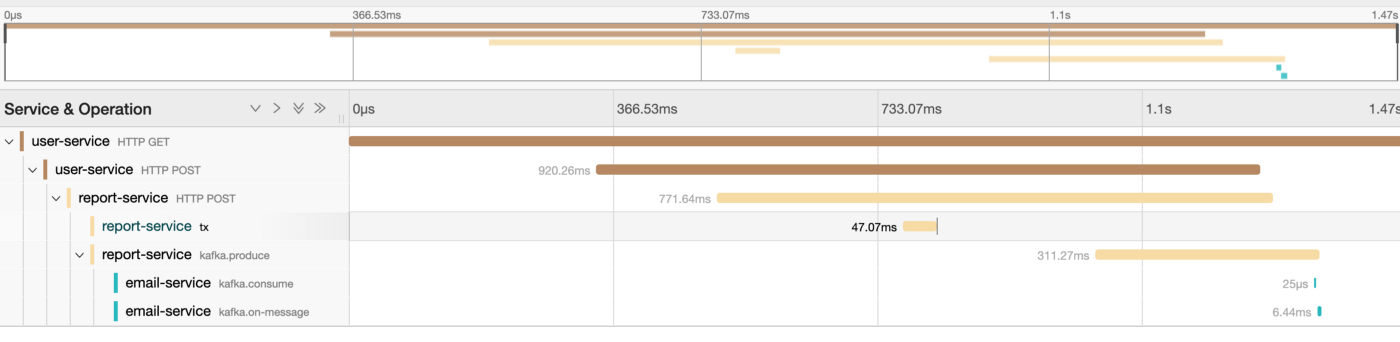
Even if the request is traveling over different protocols, the request can be tracked from the entry point to the end—an invaluable resource for debuggers.
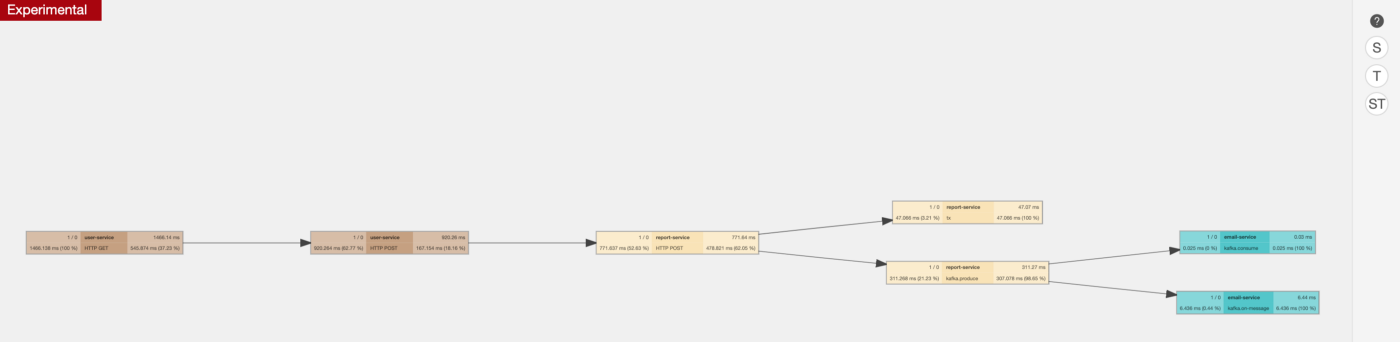
The graph is also available.
The instrumentation of requests in this demo is out-of-the-box. All requests are made via RestTemplate (Important note: RestTemplate limitation), KafkaProducer, and KafkaConsumer.
How does it work? Spring adds trace headers to the requests and receiving service (which also has sleuth support) knows how to parse those headers.
Examples are shown below.
RestTemplate example (Which is instrumented out-of-the-box):
...
public ReportClient(RestTemplate restTemplate) {
    this.restTemplate = restTemplate;
}

public Report postReportForCustomerId(Long id) {
    HttpHeaders headers = new HttpHeaders();
    headers.setContentType(MediaType.APPLICATION_JSON);

    JSONObject reportJsonObject = new JSONObject();
    reportJsonObject.put("id", id);
    reportJsonObject.put("report", "This new generated report.");

    HttpEntity<String> request = new HttpEntity<String>(reportJsonObject.toString(), headers);

    return restTemplate.postForObject(this.reportURL + "/reports", request, Report.class);
)
...
KafkaConsumer example (Created from factory):
@KafkaListener(topics = "reports", groupId = "group")
public void listenReports(Report report) {
    logger.info("Got report with: {}", report.getId());
    System.out.println("Received Message: " + report);
}
Spring has some limitations to the out-of-the-box instrumentation of tracing. It’s also possible to add trace headers manually. Check the spring docs for more information.
Working example of Spring boot, OpenTelemetry, and Jaeger
The full source code of the working setup is available on Github.
 qdnqn
qdnqn