Traffic engineering with Traefik
Introduction
Traefik is one of the most popular ingress controllers on Kubernetes. Traefik v2 brought some major changes in the usage of the controller itself. It brought the approach of heavy usage of Custom Resources on Kubernetes to provide reconfigurability and expanded fields of operation apart from the Ingress controller function. If you are one of those who started using Traefik from v1, you will agree that it was a painful switch at the first. So let's throw some light on the Traefik v2.
Also, Traefik is not the only one who changed over time. Kubernetes is also a fast-changing environment. It evolved over years to be a serious platform system. Setting up the Kubernetes cluster is art in itself with the configuration of many different categories like computation, networking, storage, etc.
There are many ways of how to set up Kubernetes cluster - provided by the different distributions from k3s, k0s; where you can use it by itself to develop or in the IoT - to the enterprise solutions provided from public cloud providers like AKS, EKS, etc.
We will use a cost-free solution: k3s. Since I am setting up everything on the macOS - I will rely on the multipass for VM orchestration (https://multipass.run/) and install k3s on the Ubuntu VM.
Installing k3s with traefik
The K3s is straightforward to set up - execute the install script provided from the website and voila - you have your Kubernetes cluster running locally.
Read a detailed article on how to install k3s.
 Adnan Selimovic
A shorter version of how to install with one-liner is given below.
curl -sfL https://get.k3s.io | sh -
Configuring Traefik usage on k3s
Traefik comes preinstalled in the k3s (I guess batteries included). This is convenient if you ask me - To prototype quickly, it's the best way to go.
K3s is relying on the Helm charts controller to deploy the charts in the cluster. Traefik and other critical systems comes preinstalled. Custom resource definitions are located in the /var/lib/rancher/k3s/server/manifests .
This is only an intro to the Traefik configuration on k3s - we will circle back to the configuration of Traefik later on.
Exploring k3s Cluster
What is pretty convenient is the fact that the external entry point is configured automatically by k3s. We will inspect the kube-system namespace.
ubuntu@k3s:~$ k get pods -n kube-system
NAME                                      READY   STATUS
local-path-provisioner-6c79684f77-zv678   1/1     Running
coredns-d76bd69b-j9b6z                    1/1     Running
metrics-server-7cd5fcb6b7-g5ff6           1/1     Running
helm-install-traefik-crd-w7b52            0/1     Completed
helm-install-traefik-tnt4w                0/1     Completed
svclb-traefik-c7zxl                       2/2     Running
traefik-df4ff85d6-w8wn4                   1/1     Running
We can see that Traefik is installed in this namespace. Let's check the services.
ubuntu@k3s:~$ k get svc -n kube-system
NAME             TYPE         CLUSTER-IP     EXTERNAL-IP
kube-dns         ClusterIP    10.43.0.10     <none>
metrics-server   ClusterIP    10.43.142.47   <none>
traefik          LoadBalancer 10.43.229.119  192.168.64.2
As you can see Traefik service has the type of LoadBalancer and external-IP is assigned. Now the cluster is accessible externally - which in our case means:
- from the Ubuntu VM
- from the Host OS - macOS
Let's hit the curl from the macOS terminal.
➜  ~ curl 192.168.64.2
404 page not found
This is the response returned from Traefik - since we don't have any ingress objects on the cluster nor the custom Traefik resources like the Ingress route.
Traefik v2 explained
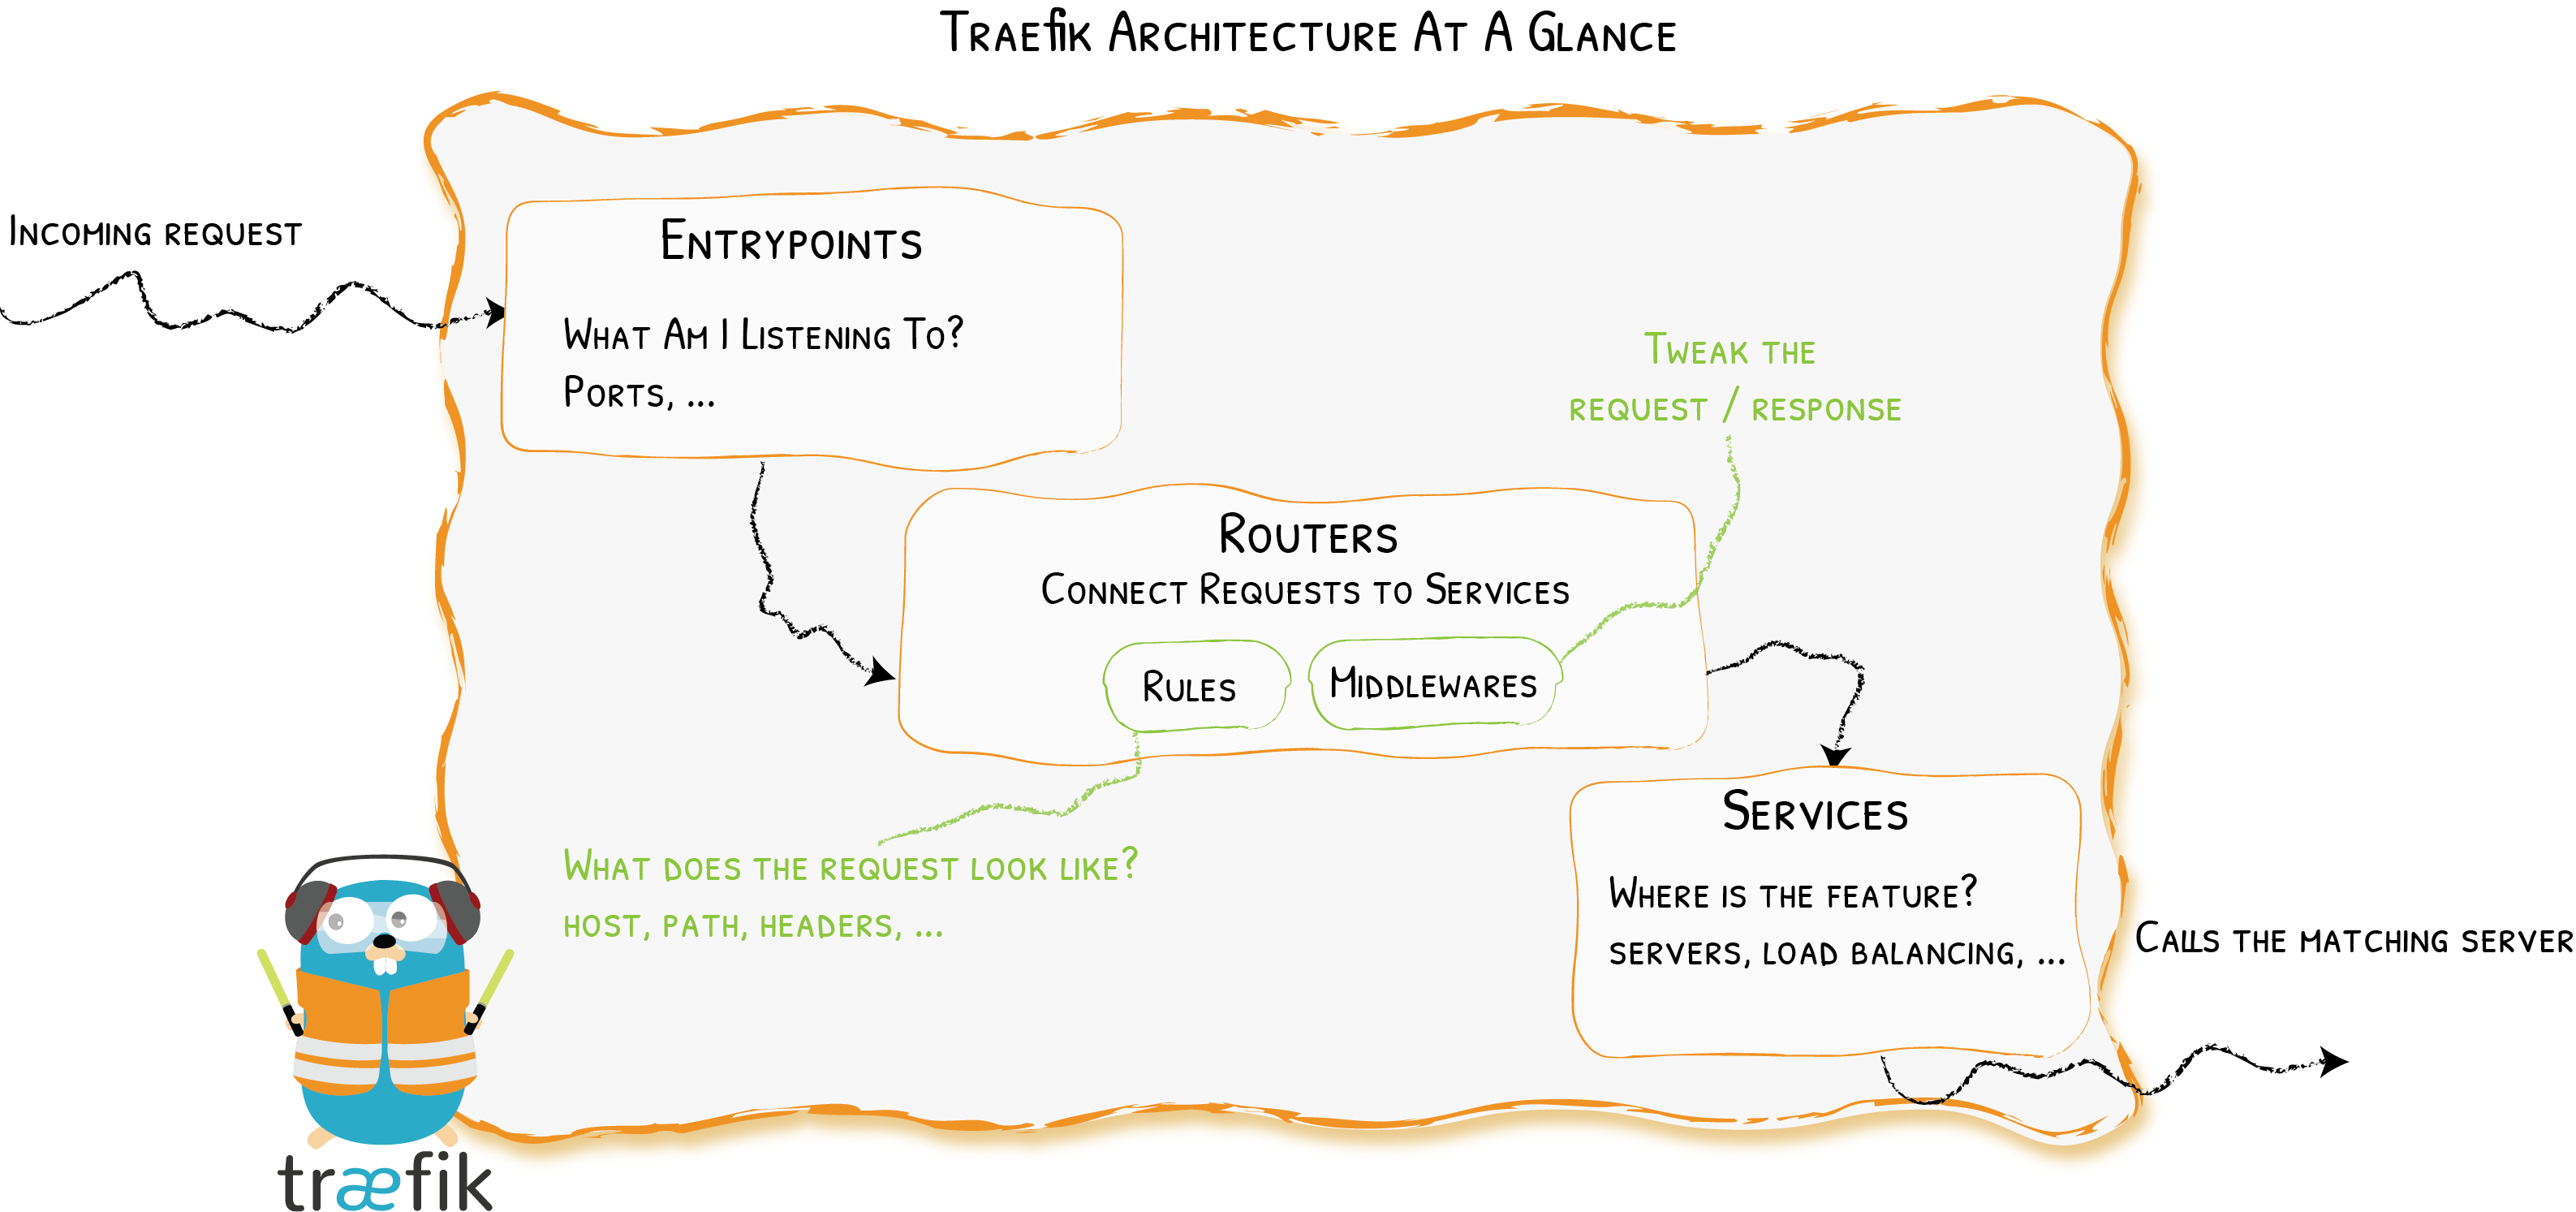
Traefik's happy path is shown in the picture above. This is a great visualization of the travel path from entry points to the backend service.
You have four types of entities involved (The most important ones):
- Entrypoint
- Routers
- Middlewares
- Services
Traefik Entrypoints
Entrypoints are as the name says - Entry points to your system. All the requests are coming to this gate and Traefik handles them later on.
With the Entrypoints, you can define network ports on which will Traefik listen for requests. They are part of static configuration and can only be set up on Traefik instantiation.
Let's analyze the K3s cluster. The cluster entrance is a service of LoadBalancer type as can be seen above.
traefik LoadBalancer 10.43.229.119 192.168.64.2 80:31525/TCP,443:30518/TCP 45hLet's see the YAML output of the service.
ubuntu@k3s:~/services$ k get svc/traefik -o yaml -n kube-system
apiVersion: v1
kind: Service
spec:
  allocateLoadBalancerNodePorts: true
  clusterIP: 10.43.229.119
  clusterIPs:
  - 10.43.229.119
  externalTrafficPolicy: Cluster
  internalTrafficPolicy: Cluster
  ipFamilies:
  - IPv4
  ipFamilyPolicy: SingleStack
  ports:
  - name: web
    nodePort: 31525
    port: 80
    protocol: TCP
    targetPort: web
  - name: websecure
    nodePort: 30518
    port: 443
    protocol: TCP
    targetPort: websecure
  selector:
    app.kubernetes.io/instance: traefik
    app.kubernetes.io/name: traefik
  type: LoadBalancer
status:
  loadBalancer:
    ingress:
    - ip: 192.168.64.2
I've removed clutter from the output and left the most important parts. LoadBalancer services are usually working on the public cloud provider because of the assigning of external IP. K3s gives you the possibility to use LB services as It relies on the Klipperlb to assign the external IP to the LB service.
For each service load balancer, a DaemonSet is created. The DaemonSet creates a pod with the svc prefix on each node.The Service LB controller listens for other Kubernetes Services. After it finds a Service, it creates a proxy Pod for the service using a DaemonSet on all of the nodes. This Pod becomes a proxy to the other Service, so that for example, requests coming to port 8000 on a node could be routed to your workload on port 8888.
This way node ports are mapped to the workload on the Kubernetes cluster. If you hit the curl 192.168.64.2:31525 - 404 page not found. Cool.
Mapping and forwarding of the ports, on k3s, below the surface is happening with the help of iptables and DNAT to do translation from Host to Cluster. You can employ iptables for inspection of the rules.
Circling back to Traefik these ports are exactly Entrypoints for the Traefik.
With the help of DNAT when you hit the curl 192.168.64.25 the answer is also 404 page not found.
Traefik Routers
Routers are the heart of your ingress. This is where the mapping of the HTTP path matches the service and forwards the request to the proper service on Kubernetes.
On the other side, Routers are part of the dynamic configuration of Traefik. What it means is that you can add/remove routers in the runtime and Traefik will pick up the configuration and make the necessary adjustments.
Traefik v2 provides a few ways to create a Router:
- Applying Kubernetes Ingress resources
- Applying custom resource IngressRoute, provided by Traefik.
- Also, other providers are included: Rancher, ECS, Consul Catalog, etc.
Traefik v2 introduced routers, obviously, because of modularity. This way concept is the same on different platforms. We will focus on Ingress and IngressRoute.
Traefik Middlewares
Before passing the request to the Kubernetes service, some preprocessing can occur using Middlewares - in both directions. Middleware is attachable on the Routers.
You can attach Middlewares to the IngressRoute like this:
---
apiVersion: traefik.containo.us/v1alpha1
kind: Middleware
metadata:
  name: stripprefix
spec:
  stripPrefix:
    prefixes:
      - /stripit
---
apiVersion: traefik.containo.us/v1alpha1
kind: IngressRoute
metadata:
  name: ingressroute
spec:
# more fields...
  routes:
    # more fields...
    middlewares:
      - name: stripprefix
Or on the Ingress object like this (Using annotations):
---
apiVersion: networking.k8s.io/v1
kind: Ingress
metadata:
  name: caddy-s1
  namespace: s1
  annotations:
    traefik.ingress.kubernetes.io/router.middlewares: kube-system-services-strip@kubernetescrd
spec:
  rules:
  - http:
      paths:
      - backend:
          service:
            name: caddy-s1
            port:
              number: 80
        path: /service1
pathType: Prefixkube-system-services-strip@kubernetescrd.Traefik Services
The Services are responsible for configuring how to reach the actual services that will eventually handle the incoming requests. Not to mix them up with the Kubernetes service. Traefik service can sit in front of the pods or k8s services.
apiVersion: traefik.containo.us/v1alpha1
kind: TraefikService
metadata:
  name: wrr2
  namespace: default
spec:
  weighted:
    services:
      - name: s1
        weight: 1
        port: 80
        # Optional, as it is the default value
        kind: Service
      - name: s3
        weight: 1
        port: 80
Deploying Caddy to the k3s
We've stomped through the important parts of the setting up of the lab and Traefik internals. Let's do some Traefik engineering or Traffic.
Caddy is the web server written in Go. It allows the definition of configuration through the Caddyfile. The plan is to deploy 4 Caddy servers on the cluster and manage the traffic using Traefik. Let's inspect Caddyfile.
{
  local_certs
  auto_https disable_redirects

  log {
    output stdout
  }
}

http://local.k3s {
  handle /metrics {
    metrics /metrics
  }

  handle {
    respond "Caddy running on k3s -> Namespace/Pod: {$MY_POD_NAMESPACE}/{$MY_POD_NAME}, IP: {$MY_POD_IP}, Node: {$MY_NODE_NAME}, IdentityUsed: {$MY_POD_SERVICE_ACCOUNT}"
  }

  log {
    output stdout
  }
}
Caddy will listen for requests on the local.k3s domain and answer with metrics on the /metrics endpoint and for all other endpoints it will respond with the pod information grabbed from the Environment variables. Neat feature.
Let's see the Caddy deployment spec.
apiVersion: apps/v1
kind: Deployment
metadata:
  name: caddy-s1
  namespace: s1
  labels:
    app: caddy-s1
spec:
  replicas: 1
  selector:
    matchLabels:
      app: caddy-s1
  template:
    metadata:
      labels:
        app: caddy-s1
    spec:
      volumes:
      - name: caddyfile
        configMap:
          name: s1-caddyfile
      containers:
      - name: caddy
        image: caddy:2.5.1-alpine
        volumeMounts:
        - name: caddyfile
          mountPath: /etc/caddy/
        ports:
        - containerPort: 80
        env:
        - name: MY_NODE_NAME
          valueFrom:
            fieldRef:
              fieldPath: spec.nodeName
        - name: MY_POD_NAME
          valueFrom:
            fieldRef:
              fieldPath: metadata.name
        - name: MY_POD_NAMESPACE
          valueFrom:
            fieldRef:
              fieldPath: metadata.namespace
        - name: MY_POD_IP
          valueFrom:
            fieldRef:
              fieldPath: status.podIP
        - name: MY_POD_SERVICE_ACCOUNT
          valueFrom:
            fieldRef:
              fieldPath: spec.serviceAccountName
We used the mapping spec info to the environment variables provided by Kubernetes to distinct the servers.
Also the ingress and service specs.
---
apiVersion: v1
kind: Service
metadata:
  name: caddy-s1
  namespace: s1
spec:
  selector:
    app: caddy-s1
  ports:
    - protocol: TCP
      port: 80
      targetPort: 80
---
apiVersion: networking.k8s.io/v1
kind: Ingress
metadata:
  name: caddy-s1
  namespace: s1
  annotations:
    traefik.ingress.kubernetes.io/router.middlewares: kube-system-services-strip@kubernetescrd
spec:
  rules:
  - http:
      paths:
      - backend:
          service:
            name: caddy-s1
            port:
              number: 80
        path: /service1
        pathType: Prefix
And Traefik middleware.
apiVersion: traefik.containo.us/v1alpha1
kind: Middleware
metadata:
  name: services-strip
  namespace: kube-system
spec:
  stripPrefix:
    prefixes:
      - /service1
      - /service2
      - /service3
      - /service4
      - /service
This is done for 4 deployments and we have the next state on the cluster. The output is similar for the 4 caddy services.
ubuntu@k3s:~$ k get all -n s1
NAME                            READY   STATUS    RESTARTS      AGE
pod/caddy-s1-7598df4db7-f9zpq   1/1     Running   4 (11h ago)   28h

NAME               TYPE        CLUSTER-IP    EXTERNAL-IP   PORT(S)   AGE
service/caddy-s1   ClusterIP   10.43.59.97   <none>        80/TCP    31h

NAME                       READY   UP-TO-DATE   AVAILABLE   AGE
deployment.apps/caddy-s1   1/1     1            1           31h

NAME                                  DESIRED   CURRENT   READY   AGE
replicaset.apps/caddy-s1-697b554c97   0         0         0       31h
replicaset.apps/caddy-s1-7598df4db7   1         1         1       31h

ubuntu@k3s:~$ k get ingress -n s1
NAME       CLASS    HOSTS   ADDRESS        PORTS   AGE
caddy-s1   <none>   *       192.168.64.2   80      31h
Let's ping the caddy-s1 from the Host machine.
➜  ~ curl local.k3s/service1
Caddy running on k3s -> Namespace/Pod: s1/caddy-s1-7598df4db7-f9zpq, IP: 10.42.0.70, Node: k3s, IdentityUsed: default
➜  ~ curl local.k3s/service3
Caddy running on k3s -> Namespace/Pod: s3/caddy-s3-664f897c8c-p4prf, IP: 10.42.0.71, Node: k3s, IdentityUsed: default
So Caddys are responding correctly. Let's change the scenario and deploy 3 Caddies in the same namespace under one ingress - use IngressRoute and TraefikService instead of k8s objects.
ubuntu@k3s:~/services$ k get pods -n s1
NAME                        READY   STATUS    RESTARTS      AGE
caddy-s1-7598df4db7-f9zpq   1/1     Running   4 (11h ago)   29h
caddy-s2-5fcbb5dc65-rlpk9   1/1     Running   0             62s
caddy-s3-664f897c8c-6nxdr   1/1     Running   0             2s
Traefik IngressRoute round-robin
New ingress configuration. Now we are using CR TraefikService and IngressRoute.
---
apiVersion: traefik.containo.us/v1alpha1
kind: TraefikService
metadata:
  name: wrr-caddies
  namespace: s1
spec:
  weighted:
    services:
      - name: caddy-s1
        weight: 1
        port: 80
      - name: caddy-s2
        weight: 1
        port: 80
      - name: caddy-s3
        weight: 1
        port: 80
---
apiVersion: traefik.containo.us/v1alpha1
kind: IngressRoute
metadata:
  name: ingressroute-caddies
  namespace: s1
spec:
  entryPoints:
    - web
    - websecure
  routes:
    - match: Host(`local.k3s`) && Path(`/service`)
      kind: Rule
      services:
        - name: wrr-caddies
          namespace: s1
          kind: TraefikService
We've defined TraefikService to serve the request following the Weighted Round Robin algorithm - Since every weight is 1 it will serve plain Round robin. The IngressRoute will listen for requests at local.k3s/service only (Exact match).
Let's call curl multiple times.
➜  ~ curl local.k3s/service
Caddy running on k3s -> Namespace/Pod: s1/caddy-s1-7598df4db7-5dld6, IP: 10.42.0.87, Node: k3s, IdentityUsed: default
➜  ~ curl local.k3s/service
Caddy running on k3s -> Namespace/Pod: s1/caddy-s3-664f897c8c-rphsd, IP: 10.42.0.89, Node: k3s, IdentityUsed: default
➜  ~ curl local.k3s/service
Caddy running on k3s -> Namespace/Pod: s1/caddy-s2-5fcbb5dc65-xrc72, IP: 10.42.0.88, Node: k3s, IdentityUsed: default
➜  ~ curl local.k3s/service
Caddy running on k3s -> Namespace/Pod: s1/caddy-s3-664f897c8c-rphsd, IP: 10.42.0.89, Node: k3s, IdentityUsed: default
➜  ~ curl local.k3s/service
Caddy running on k3s -> Namespace/Pod: s1/caddy-s2-5fcbb5dc65-xrc72, IP: 10.42.0.88, Node: k3s, IdentityUsed: default
➜  ~ curl local.k3s/service
Caddy running on k3s -> Namespace/Pod: s1/caddy-s1-7598df4db7-5dld6, IP: 10.42.0.87, Node: k3s, IdentityUsed: default
We can see the Round Robin pattern here.
Traefik IngressRoute weighted round-robin
Let's change the weight and restart the pods so that metrics start from a fresh state.
---
apiVersion: traefik.containo.us/v1alpha1
kind: TraefikService
metadata:
  name: wrr-caddies
  namespace: s1
spec:
  weighted:
    services:
      - name: caddy-s1
        weight: 50
        port: 80
      - name: caddy-s2
        weight: 30
        port: 80
      - name: caddy-s3
        weight: 20
        port: 80
Let's check the metrics of the Caddy pods. We are interested in the caddy_http_requests_total. It shows a number of served requests.
➜  ~ curl -s local.k3s/service1/metrics | grep caddy_http_requests_total{
caddy_http_requests_total{handler="metrics",server="srv0"} 1
caddy_http_requests_total{handler="subroute",server="srv0"} 2
➜  ~ curl -s local.k3s/service2/metrics | grep caddy_http_requests_total{
caddy_http_requests_total{handler="metrics",server="srv0"} 1
caddy_http_requests_total{handler="subroute",server="srv0"} 2
➜  ~ curl -s local.k3s/service3/metrics | grep caddy_http_requests_total{
caddy_http_requests_total{handler="static_response",server="srv0"} 1
caddy_http_requests_total{handler="subroute",server="srv0"} 2
We can see that metrics are clean. Let's send N consecutive requests and check the metrics.
for i in `seq 1 100`; do curl http://local.k3s/service; doneResponse given:
➜  ~ curl -s local.k3s/service1/metrics | grep caddy_http_requests_total{
caddy_http_requests_total{handler="static_response",server="srv0"} 50
caddy_http_requests_total{handler="subroute",server="srv0"} 100
➜  ~ curl -s local.k3s/service2/metrics | grep caddy_http_requests_total{
caddy_http_requests_total{handler="static_response",server="srv0"} 30
caddy_http_requests_total{handler="subroute",server="srv0"} 60
➜  ~ curl -s local.k3s/service3/metrics | grep caddy_http_requests_total{
caddy_http_requests_total{handler="static_response",server="srv0"} 20
caddy_http_requests_total{handler="subroute",server="srv0"} 40
Load balancing is following the rules we set: 50, 30, and 20. What is the benefit of manipulating the traffic in this way? One popular use case is Canary releases. Also, any need for redistributing traffic to take the load of specific servers - you can easily employ the Traefik to do the heavy work for you.
We've seen how to steer the traffic in the direction we want. Let's see the restrictions in action.
Traefik rate limiting
Rate limiting is used when you want to restrict how many calls can be made to the exposed endpoints. Traefik implements rate limiting using Middlewares. You can assign specific rate limit rules per ingress defined which is handy.
Rate limit middleware looks like this.
apiVersion: traefik.containo.us/v1alpha1
kind: Middleware
metadata:
  name: test-ratelimit
spec:
  rateLimit:
    average: 1
    burst: 1
    period: 10
This middleware defines a limit of 1 request per period seconds with an additional 1 request of burst per period seconds. The period is equal to 10s. Let's assign this middleware to the /service endpoint.
apiVersion: traefik.containo.us/v1alpha1
kind: IngressRoute
metadata:
  name: ingressroute-caddies
  namespace: s1
spec:
  entryPoints:
    - web
    - websecure
  routes:
    - match: Host(`local.k3s`) && Path(`/service`)
      kind: Rule
      middlewares:
        - name: test-ratelimits
          namespace: kube-system
      services:
        - name: wrr-caddies
          namespace: s1
          kind: TraefikService
Let's test it.
➜  ~ curl -s local.k3s/service
Caddy running on k3s -> Namespace/Pod: s1/caddy-s1-7598df4db7-9wkls, IP: 10.42.0.109, Node: k3s, IdentityUsed: default%
➜  ~ curl -s local.k3s/service
Too Many Requests%
➜  ~ curl -s local.k3s/service
Too Many Requests%
➜  ~ curl -s local.k3s/service
Too Many Requests%
➜  ~ curl -s local.k3s/service
Too Many Requests%
➜  ~ curl -s local.k3s/service
Caddy running on k3s -> Namespace/Pod: s1/caddy-s2-5fcbb5dc65-wlxjl, IP: 10.42.0.108, Node: k3s, IdentityUsed: default%
➜  ~ curl -s local.k3s/service
Too Many Requests%
As you can see - Traefik only allows 1 request every 10 seconds.
You can do rate limiting based on the sourceCriterion.
sourceCriterionThe sourceCriterion option defines what criterion is used to group requests as originating from a common sourceIf none are set, the default is to use the request's remote address field.
You can rate limit based on the:
sourceCriterion.ipStrategysourceCriterion.requestHeaderNamesourceCriterion.requestHost
An ipStrategy allows you to implement rate-limiting based on the request IP address. You can use the depth and excludedIPs parameters to define which IP will be used when the end service receives a X-forwarded-for header. An example is given below.
apiVersion: traefik.containo.us/v1alpha1
kind: Middleware
metadata:
  name: test-ratelimit
spec:
  rateLimit:
    sourceCriterion:
      ipStrategy:
depth: 2Ifdepthis set to 2, and the requestX-Forwarded-Forheader is"10.0.0.1,11.0.0.1,12.0.0.1,13.0.0.1"then the "real" client IP is"10.0.0.1"(at depth 4) but the IP used as the criterion is"12.0.0.1"(depth=2).
Another rate-limiting strategy type is to use requestHeader as a grouping ID.
apiVersion: traefik.containo.us/v1alpha1
kind: Middleware
metadata:
  name: test-ratelimit
spec:
  rateLimit:
    sourceCriterion:
      requestHeaderName: username
This way you can implement rate-limiting per user or its some other attribute.
You can read more about rate-limiting with Traefik at the https://doc.traefik.io/traefik/middlewares/http/ratelimit/.
Conclusion
Traefik is letting you have a lot of control over the traffic through the Ingresses. Apart from steering traffic, you can limit it or even employ sticky load balancing. This blog post focused on the introduction to traffic engineering with the options provided by Traefik.
Load balancing and rate-limiting represent the foundation of traffic engineering setup for deployments on the Kubernetes. It can let you optimize load to have a better user experience, release new versions of the deployments, and hotfix bad situations, in a fairly easy manner.
To learn more about Traefik, dive into the official docs at the https://doc.traefik.io/traefik/.